Popular

- Manage License (Add on)
- Bulk Revoke
- Generating Access Code
- Direct Distribution (Add On)
- Creating Single User or Multiple Users (Bulk Upload)
- Admin Center and Profile and Settings
- Revoking Content
- Distributing Content
- Signing in to Kitaboo
- Promote User/Transfer
- Create Class/Update Class
- Selective Oneroster Sync with API/ZIP/SFTP

- Customer Order Details -View Order
- License Management
- Analytics Dashboard and Reports Overview
- How Kitaboo Reader – Text-to-Speech (TTS) Works
- Activated User – Definition & Billing Policy
- What is Sequential Learning and How to Enable It? (Add On)
- Understanding User Roles: Producer vs. Admin
- How to Add External LTI Link (Add-On)
- Auto Book Deletion Process
- Adding group with SAML
- Syncing Data with Clever
- Selective Oneroster Sync with API/ZIP/SFTP
- Syncing Data with PowerSchool
- Syncing Data with OneRoster
- Adding a Group
- Searching a Customer
- Issuing Licenses
- Editing a Customer
- Deactivating a Customer
- Adding a Google Classroom Customer
- Adding a OneRoster Customer
- Adding One roster 1.2
- Adding a LTI 1.3 Customer with OneRoster
- Adding a LTI 1.3 Customer
- Adding an LTI 1.1 Customer with OneRoster
- Adding LTI 1.1 Customers
- Sorting Customer and Group
- Creating a Collection
- Enable K-AI at the content level
- Content Lifecycle Stages in Kitaboo for eBooks
- Creating a Fixed-layout Kitaboo eBooks
- Creating Fixed-layout ePub 3.0
- Upload 3rd Party ePub 2.0/3.0
- Creating a Course or Uploading Scorm
- Activity or Gradable Activity Creation
- Authoring an ePub
- Creating a Video Book
- Creating an Audio Book
- Updating the Cover Image
- Editing a Fixed eBook
- Deleting and Deactivating Content
- Users Tab
- How to Edit and Delete a Category
- Clever Integration
- Classlink Integration
- Canvas LTI Integration
- Admin Center
- Analytics Tab
- Adding a Customer
- Creating Admin Accounts
🎯 Kitaboo Dashboard Analytics:
Kitaboo provides a comprehensive set of analytics reports for Administrators and Publishers to help monitor user engagement, license usage, content performance, and platform behavior.
All dashboard reports allow you to select a custom date range (Start Date–End Date).
Please note: Real-time analytics are not available. Data is updated once every 24 hours.

1. Activated Users Report
Purpose
Identifies all users considered “activated” for billing or contractual usage purposes.
An activated user is typically defined as someone who has accessed the platform within the selected period.
Value:
-
Ensures transparency for billing & license compliance
-
Helps publishers identify active vs inactive users
-
Supports customer success teams in identifying engagement gaps
-
Useful for contracts where cost is tied to “active users”
What Data You Receive (Downloadable Sheet)
- User ID
- First Name
- Last Name
- Username
- First Accessed Date
- Last Accessed Date
- User Status

2. Content Licenses Report
Purpose
Tracks total licenses purchased and their utilization, helping publishers understand distribution and consumption patterns.
Value:
-
Enables better license planning and entitlement management
-
Identifies unused inventory to reduce cost leakage
-
Helps publishers forecast future purchases or renewals
-
Supports schools/districts in ensuring students and teachers have access
What Data You Receive
- Customer Name
- Total Licenses
- Distributed Licenses
- Consumed Licenses
- Unused Licenses
Dashboard Metrics Include:
Total License Count, Distributed, Unused, Accessed, Not Yet Accessed.

3. Ten Most Active Customers
Purpose
Highlights schools/institutions with the highest engagement based on total reading time.
Value:
-
Helps publishers identify top-performing customers
-
Pinpoints high-engagement districts for upsell opportunities
-
Supports targeted customer success efforts
-
Useful during renewals to show value delivered
What Data You Receive
- Customer/School Name
- Number of Unique Users
- Number of Sessions
- Total Time Spent (Hours)

4. Ten Most Popular Titles
Purpose
Shows which titles are receiving the most user engagement based on time spent and user activity.
Value:
-
Helps identify high-performing content
-
Supports editorial teams in planning future editions
-
Helps understand which subjects/topics users prefer
-
Useful for marketing, product improvement, and ROI analysis
What Data You Receive
- Title Name
- Total Licenses
- Total Licenses Assigned
- Number of Unique User Accesses
- Number of Sessions
- Total Time Spent (Seconds)

5. Content Coverage Report
Purpose
Helps publishers understand which chapters or sections users are spending the most time reading.
Useful for instructional design and content optimization.
Value:
-
Helps instructional designers refine content structure
-
Identifies content gaps or underused chapters
-
Helps publishers understand learner behavior deeply
-
Supports curriculum teams in reordering or improving chapters
What Data You Receive
- User ID
- Object ID
- Title Name
- Chapter Name
- Total Time Spent (HH:MM:SS)

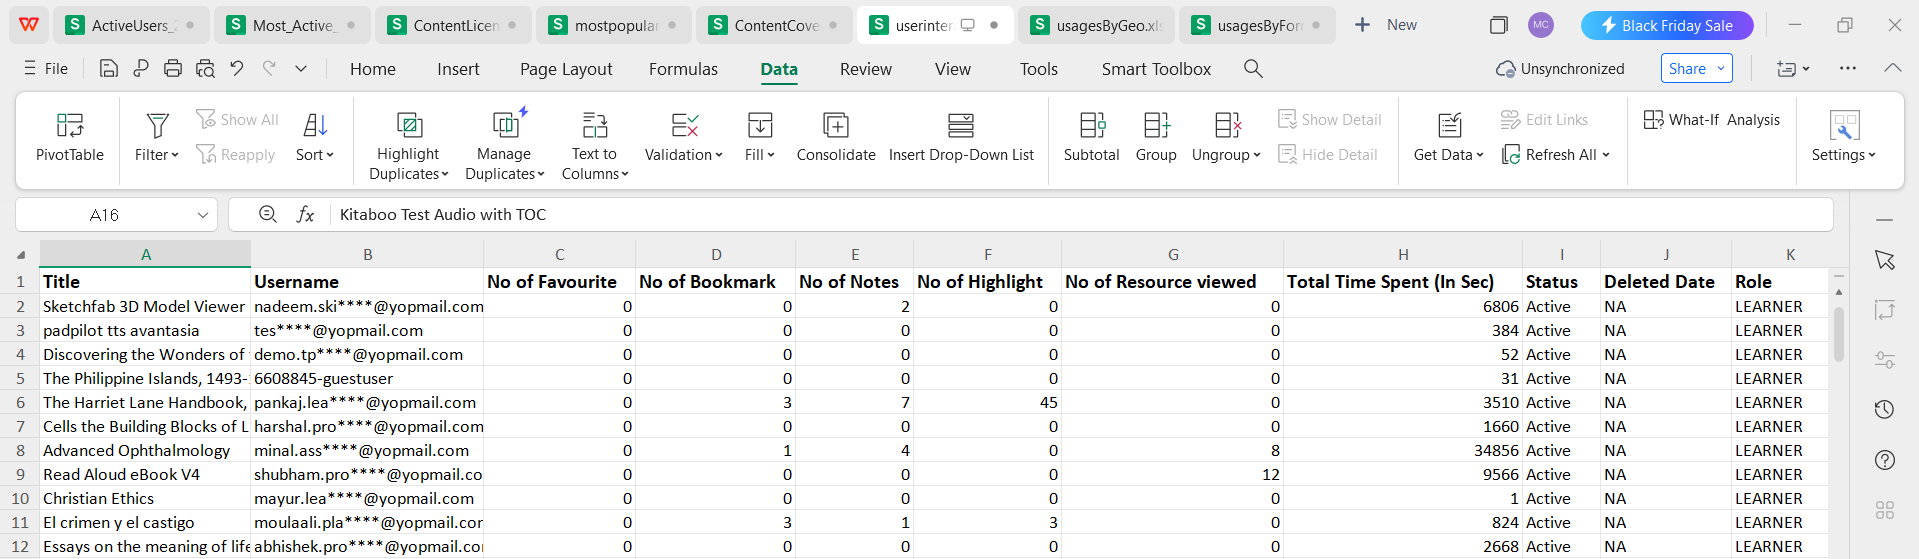
6. User Interaction Report
Purpose
Displays how users are interacting with reader tools such as notes, highlights, bookmarks, resources, and favorites.
Value:
-
Measures active learning behavior
-
Helps educators understand study habits
-
Helps optimize reader features & tools
-
Offers insights into engagement quality (not just quantity)
What Data You Receive
- Title
- Username
- First Name
- Last Name
- Number of Favorites
- Number of Bookmarks
- Number of Notes
- Number of Highlights
- Number of Resources Viewed
- Total Time Spent (Seconds)
- User Role
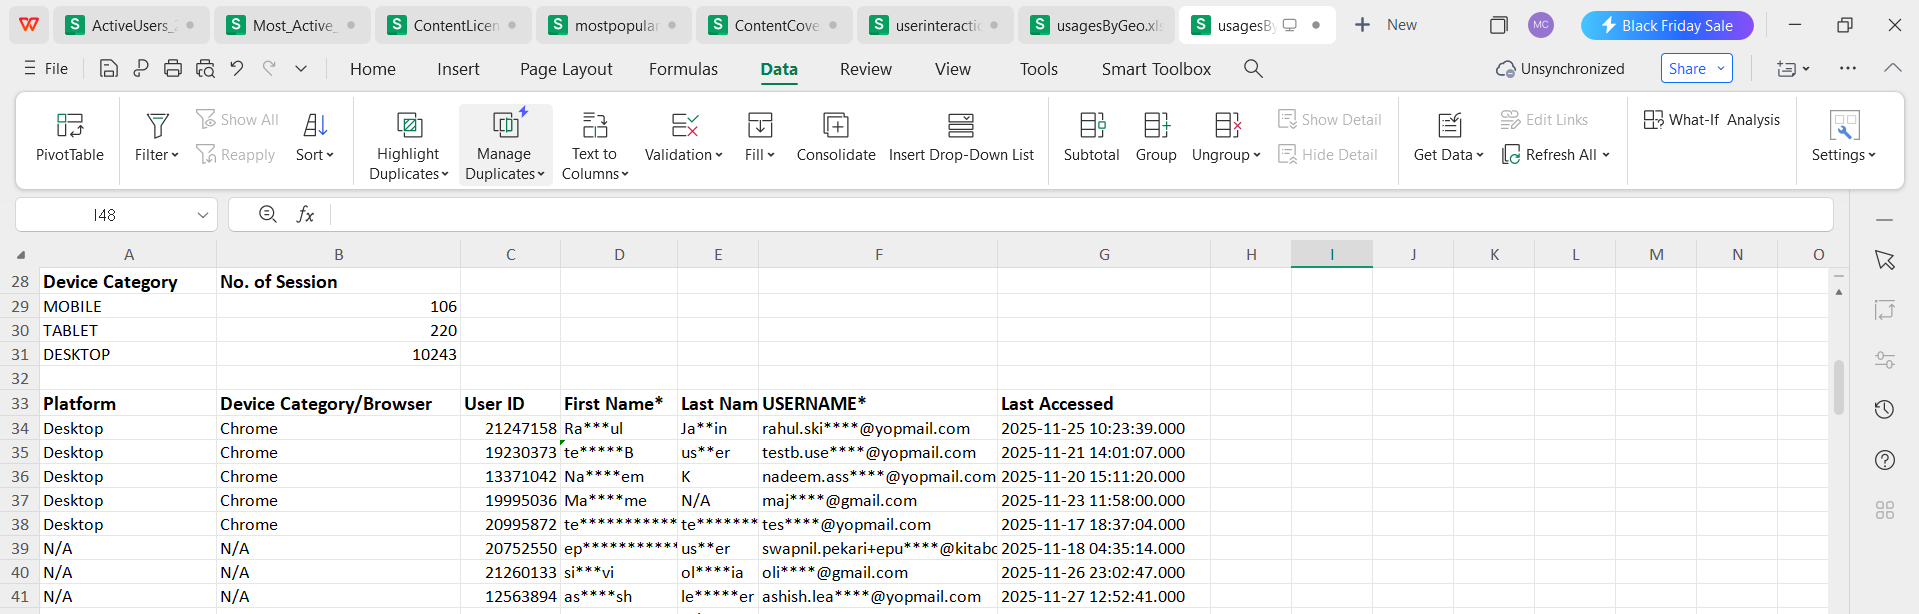
7. Web Player: Usage by Format
Purpose
Shows which platforms and browsers users prefer while accessing the Web Reader (desktop/mobile browser usage only; excludes apps).
Value:
-
Helps optimize reader performance for most-used devices/browsers
-
Helps IT teams plan for device rollouts
-
Supports accessibility and UI/UX improvements
-
Useful when troubleshooting browser-specific issues
What Data You Receive
- Platform
- Device Category / Browser (e.g., Desktop Chrome, Mobile Safari)
- User ID
- First Name
- Last Name
- Username
- Last Accessed Date
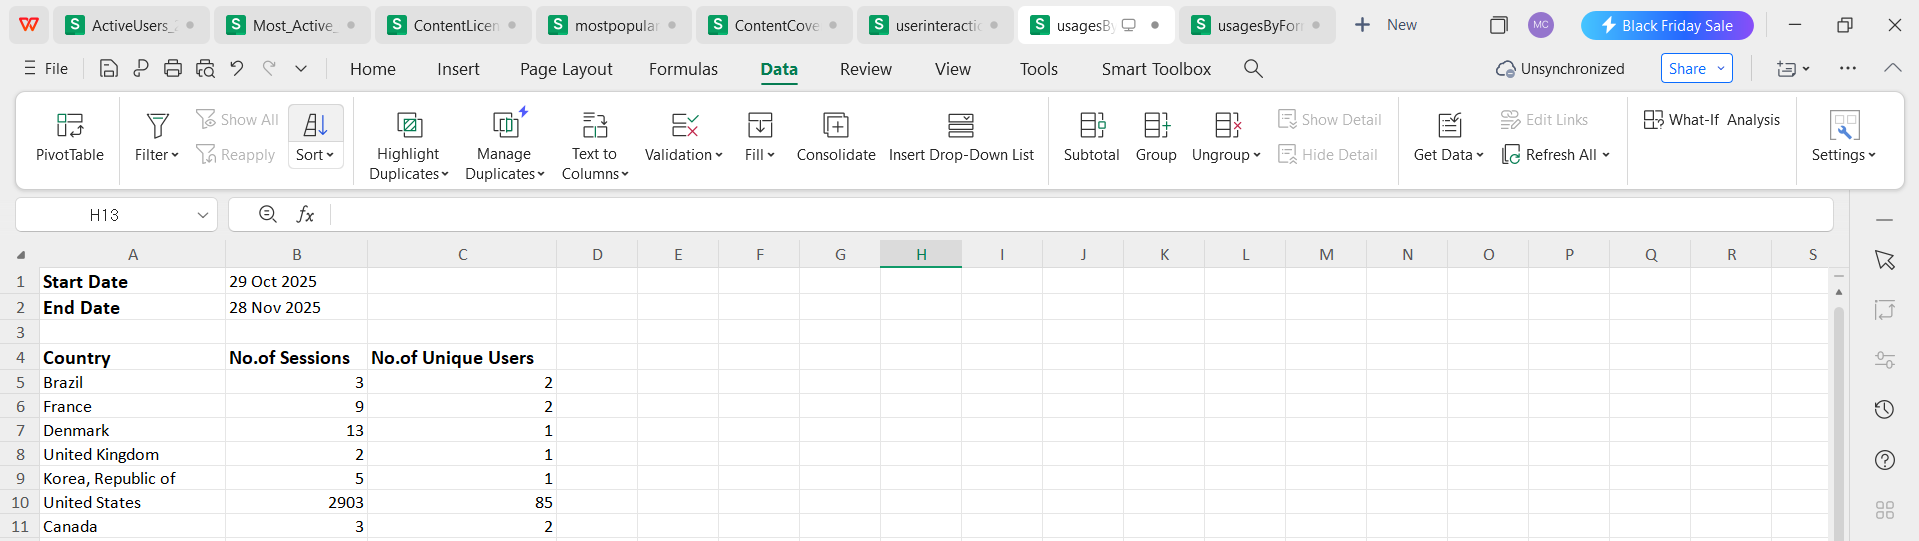
8. Usage by Geography
Purpose
Provides geographic insights into where users are accessing the reader (based on user location permissions).
Value:
-
Helps publishers understand geographic penetration
-
Useful for regional sales, outreach, and localization
-
Helps identify international adoption patterns
-
Supports compliance in region-specific usage audits
What Data You Receive
- Country Name
- Number of Sessions
- Number of Unique Users
Conclusion
These analytics reports help publishers and administrators gain deep insights into:
- User activity and engagement
- License usage and consumption patterns
- Content popularity and chapter-level performance
- Interaction with learning tools
- Platform access behavior (devices, browsers, locations)
🎯 Kitaboo Additional Reports:
In addition to dashboard analytics, Kitaboo provides several detailed reports that offer deeper insights into content usage, offline downloads, user activity, access codes, and K.AI interactions.
These reports can be exported for further analysis and are available to Administrators and Publishers as per their access rights.
All reports allow you to select a custom date range (Start Date–End Date).
Please note: Real-time analytics are not available. Data is updated once every 24 hours.
1. Book Distribution Details Report
Purpose
Tracks how many users download a specific title across various Kitaboo applications for offline reading.
Also provides insights into reading engagement through “Average Time Spent” for most-read titles.
Value:
-
Shows true usage beyond online platforms
-
Helps identify device preferences
-
Useful for measuring adoption in low-connectivity regions
-
“Average Time Spent” helps identify highly engaging titles
Data Included
- ISBN
- Title
- No. of Downloads – Android App
- No. of Downloads – iOS App
- No. of Downloads – HTML Offline Reader
- Total Downloads

2. Book Status Report
Purpose
Provides visibility into all titles uploaded, processed, or converted in the Kitaboo ecosystem, along with their metadata and conversion status.
Useful for catalog auditing and production monitoring.
Value:
-
Supports production workflow management
-
Helps identify titles with conversion issues
-
Useful for catalog audits
-
Supports content lifecycle & version control
Data Included
- Book ID
- Book ISBN
- Book Title
- Category Name
- Collection Name
- Status (Uploaded, Converted, Published, Archived, etc.)
- Page Count
- Last Modified On

3. Book Statistics Report
Purpose
Shows which users accessed a specific title, how long they spent reading it, and which institution they belong to.
Helps publishers understand usage frequency and engagement patterns for each book.
Value:
-
Helps measure content engagement and learning outcomes
-
Shows which institutions actively use the content
-
Helps identify low-usage titles needing intervention
-
Useful for student/teacher analytics in K12/HED
Data Included
- Book ID
- Book Reference ID
- ISBN
- Title
- Number of Unique Users Who Accessed the Book
- Total Time Spent
- Client/Institute ID

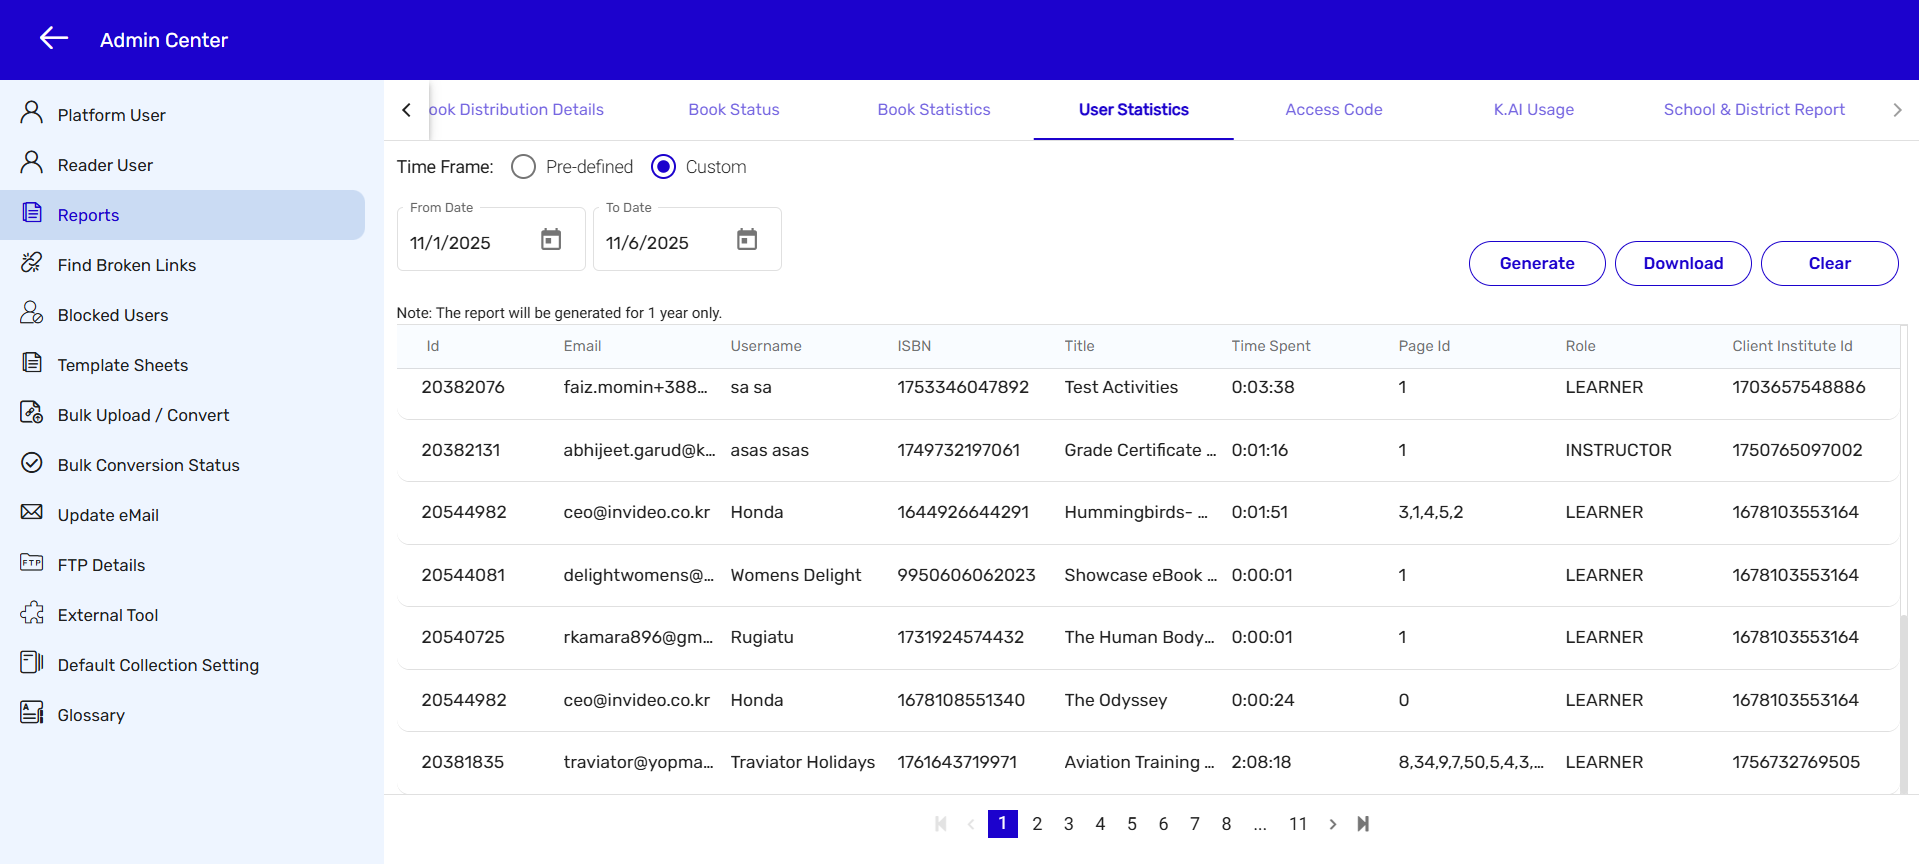
4. User Statistics Report
Purpose
Provides title-access information at the individual user level.
Helps track user learning behavior, time spent, and the specific pages accessed.
Value:
-
Helps track individual learner activity
-
Supports personalized learning insights
-
Allows educators to identify learning gaps
-
Useful for teacher dashboards and remediation planning
Data Included
- User ID
- Username
- ISBN
- Title
- Time Spent
- Accessed Page IDs
- User Role (Student/Teacher/Admin)
- Client/Institute ID
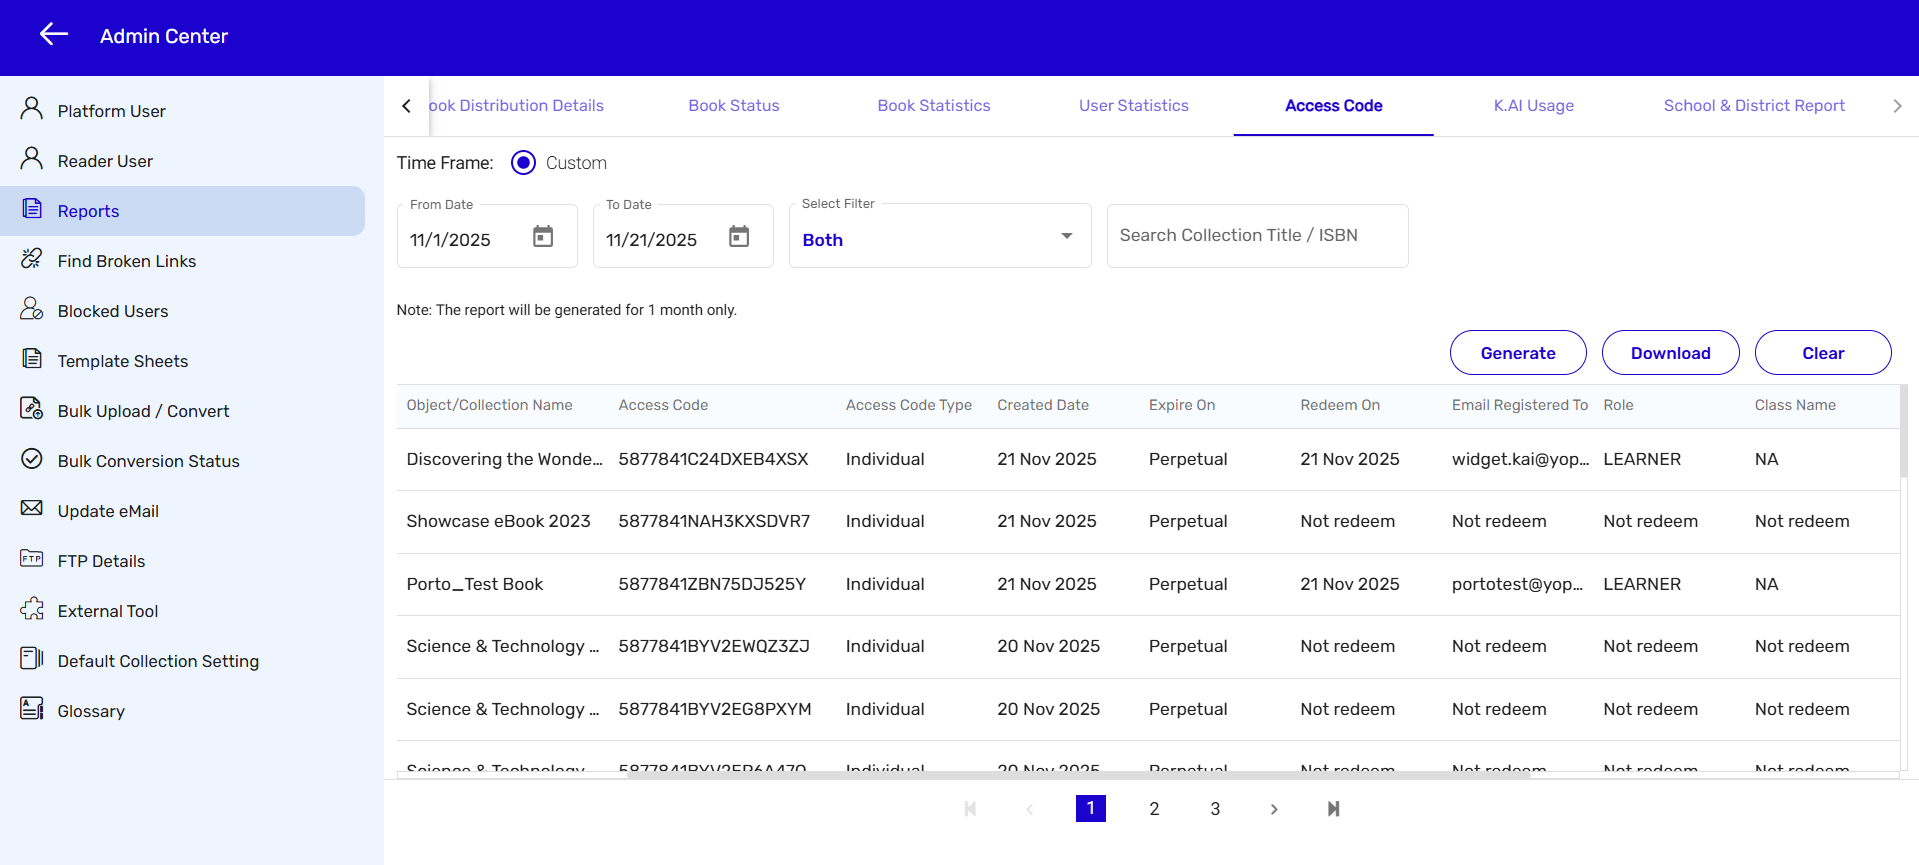
5. Access Code Report (Add-on Report – Available at Additional One-Time Cost)
Purpose
Gives complete details on access code lifecycle and usage.
Useful for monitoring distribution, redemption, activation, expiry, and user association.
Value:
-
Helps publishers track code usage for compliance
-
Prevents revenue leakage by detecting unused or expired codes
-
Supports content access troubleshooting
-
Useful for campaign-based access distribution
Data Included
- Order ID
- Object/Collection ID
- Object/Collection Name
- Access Code
- Access Code Type
- Created Date
- Expiry Date
- Redeemed On
- Email Registered To
- User Role
- Class Name
- School Name
- District Name
- Access Code Status
- User Status (Active, Inactive, etc.)
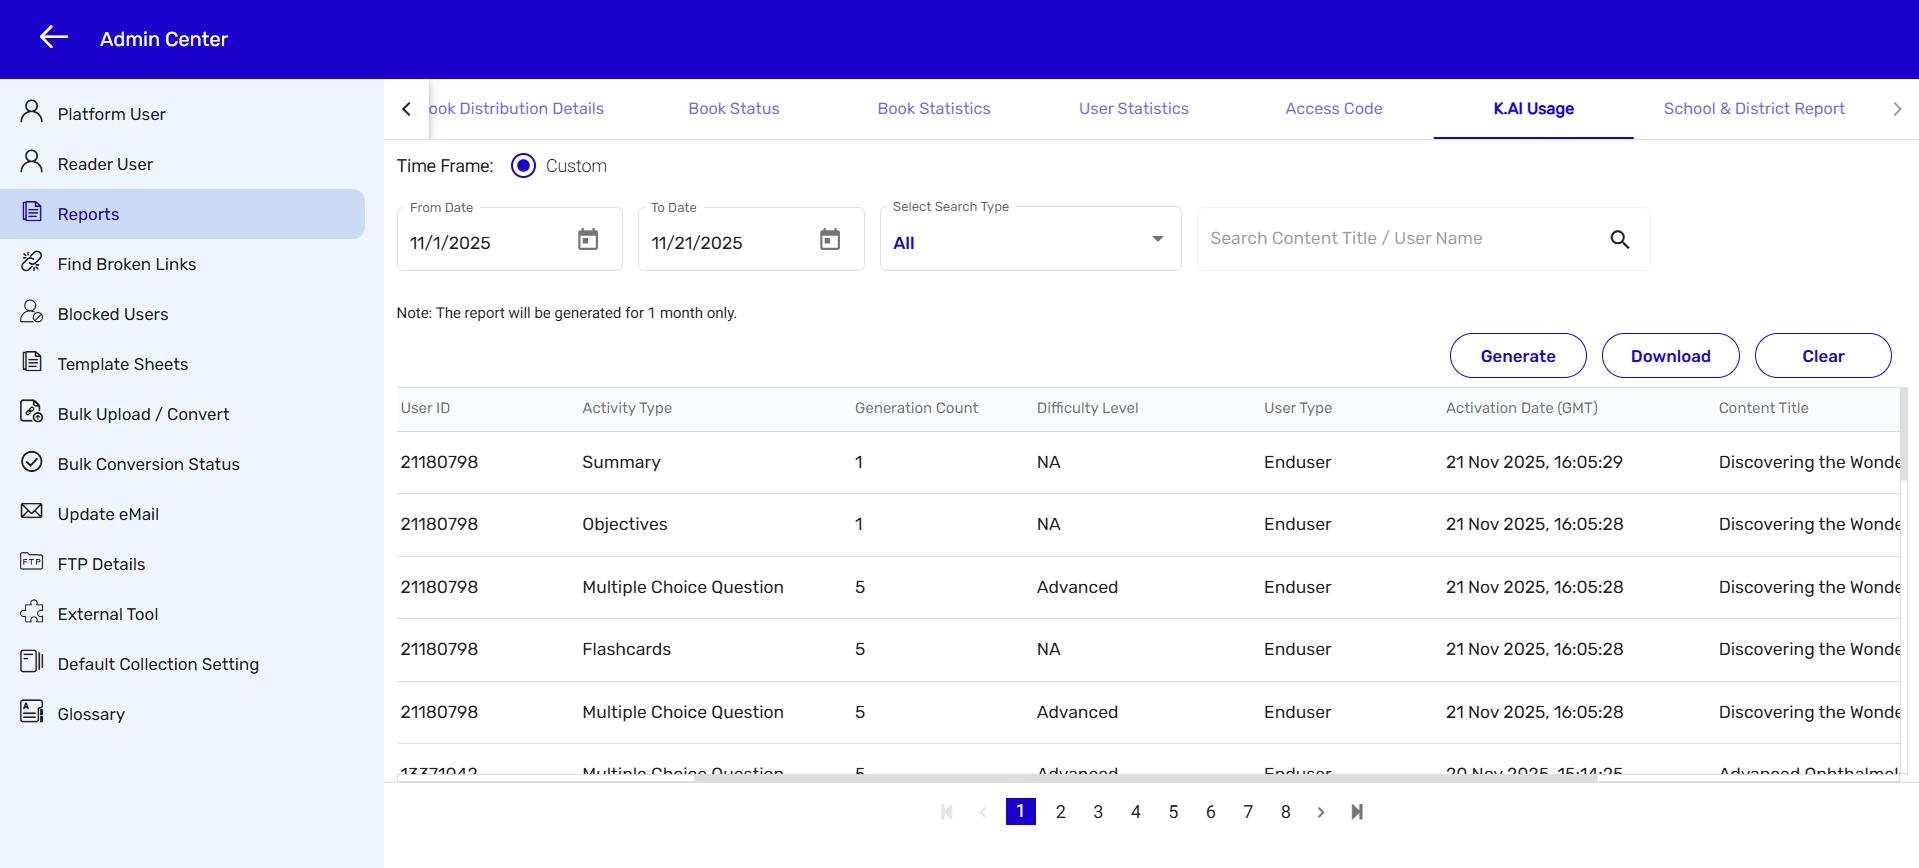
6. K.AI Usage Report (Add-on Report – Available at Additional One-Time Cost)
Purpose
Tracks the usage of Kitaboo’s AI features (K.AI), including who used AI, on which titles, what types of activities were generated, and how often.
Supports AI adoption monitoring and content-effectiveness insights.
Value:
-
Helps measure adoption of AI features
-
Identifies which activities are most helpful for learners
-
Supports decision-making for AI enhancements
-
Helps publishers understand content readiness for AI
Data Included
- Book ID
- Client ID
- User ID
- Activity Type (Summary, MCQ, Flashcards, Objectives, etc.)
- Generation Count
- User Type
- Activation Date (GMT)
- Content Title
- User Name
Summary
These additional reports provide detailed operational and engagement insights that go beyond high-level dashboards. They help publishers:
- Track offline downloads across platforms
- Monitor content production and conversion workflows
- Understand title-level and user-level engagement
- Manage access-code distribution and usage
- Measure adoption of AI-driven capabilities
🎯 School & School District Reports:
Kitaboo provides a comprehensive suite of operational reports designed for schools and districts to monitor licenses, user distribution, onboarding status, and overall usage health. These reports are not dashboard-style graphs; instead, they provide structured, exportable data to support administration, compliance, and decision-making.
Please note: Real-time analytics are not available. Data is updated once every 24 hours.
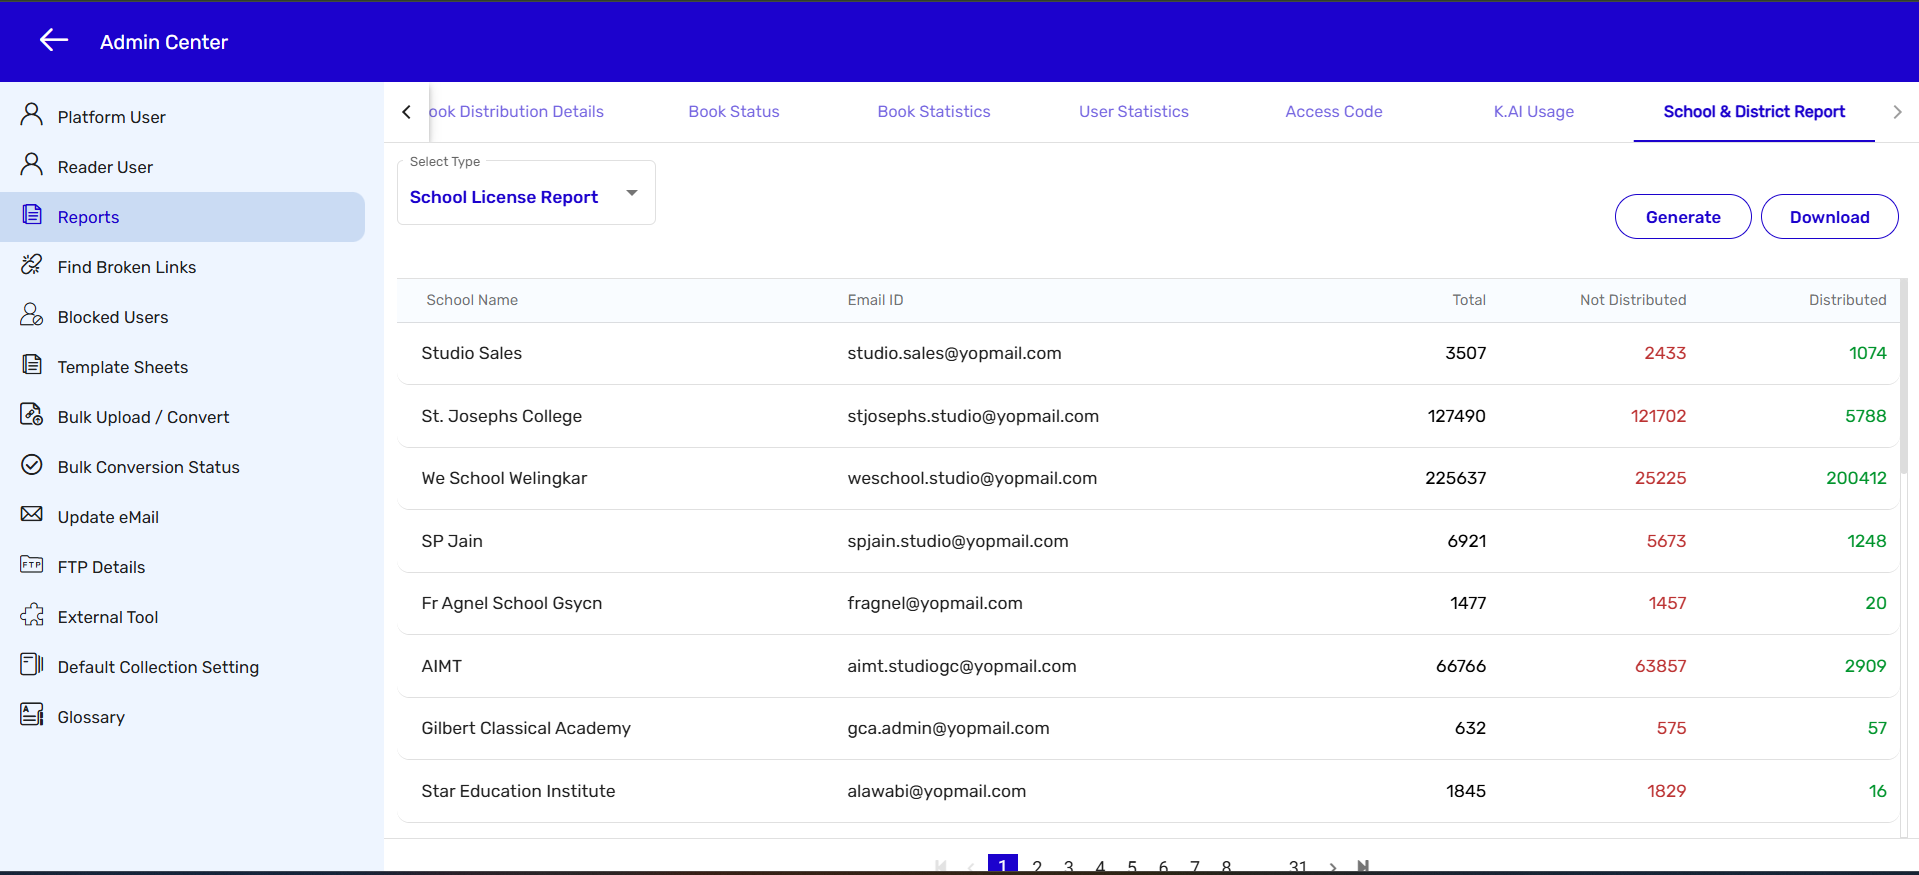
1. School License Report
Purpose:
This report helps schools track the status of all licenses issued for their institution. Administrators can easily identify how many licenses have been generated, how many are already assigned to users, and how many remain unused. This ensures better planning, allocation decisions, and compliance with purchased entitlements.
Value:
-
Helps avoid over-purchasing or underutilization
-
Supports yearly planning and budgeting
-
Useful for compliance reporting
-
Makes audit and renewal cycles more predictable
Key Data Fields:
- School Name
- School Email ID
- Total License Count
- Not Distributed License Count
- Distributed License Count
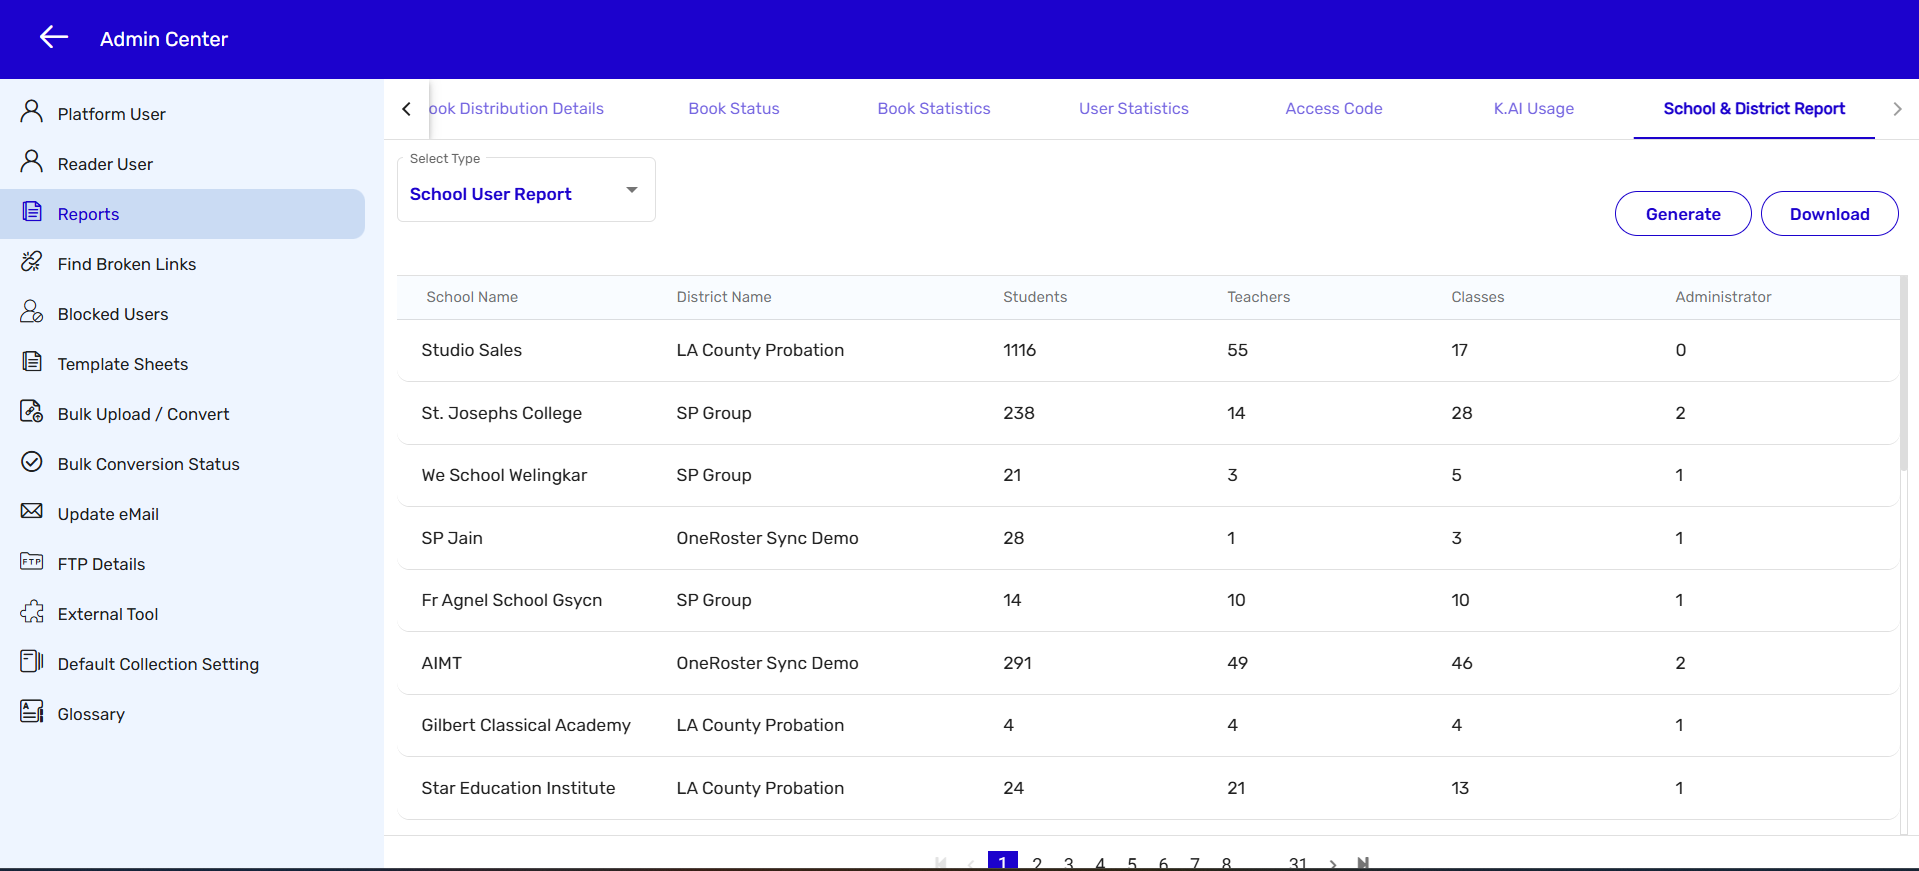
2. School User Report
Purpose:
This report gives a clear picture of a school’s total user population. It helps administrators understand user demographics and the structure of the institution, supporting both academic planning and operational alignment.
Value:
-
Helps administrators validate roster accuracy
-
Supports curriculum planning and classroom allocation
-
Useful for state reporting and compliance
-
Helps observe student/teacher ratios
Key Data Fields:
- School Name
- District Name
- Number of Students
- Number of Teachers
- Number of Classes
- Number of Administrators
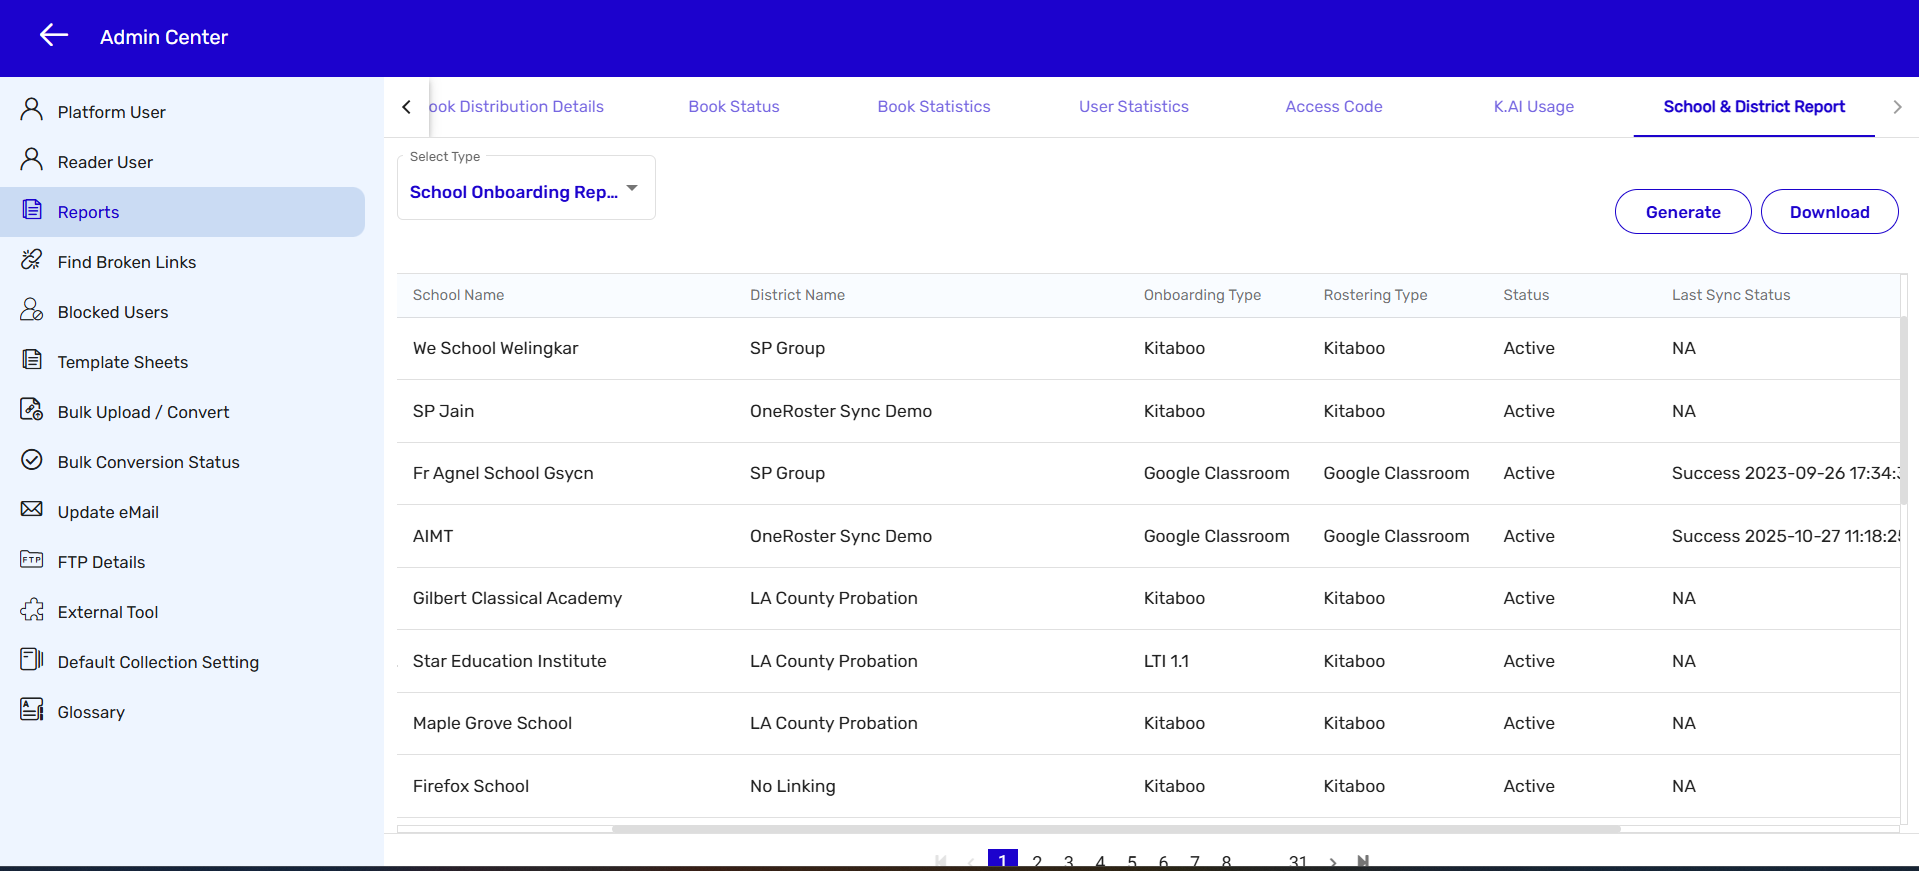
3. School Onboarding Report
Purpose:
This report provides complete visibility into how a school’s user data has been onboarded into Kitaboo. It includes onboarding method (Google Classroom, LTI, OneRoster, etc.), rostering configuration, last sync status, and the frequency of data updates. This helps IT teams monitor roster integration and quickly diagnose sync issues.
Value:
-
Helps IT teams identify roster issues quickly
-
Ensures users always have correct content access
-
Reduces onboarding support tickets
-
Ensures compliance with district rostering standards
Key Data Fields:
- Created On
- Client Institute ID
- School Name
- District Name
- Onboarding Type (Google Classroom, LTI, OneRoster, etc.)
- Rostering Type
- Status (Active/Inactive/Failed, etc.)
- Last Sync Status
- Sync Frequency
- Period (Daily / Monthly / Yearly)
4. District License Report
Purpose:
This report helps district administrators manage licenses across all schools within the district. It shows how many licenses were generated, distributed, and still pending distribution. This ensures smooth licensing operations across large-scale implementations.
Value:
-
Allows district administrators to manage licensing at scale
-
Helps equal distribution across multiple schools
-
Useful during renewal cycles for planning
-
Ensures alignment with district-wide budgets
Key Data Fields:
- School District Name
- School District Email ID
- Total License Count
- Not Distributed License Count
- Distributed License Count

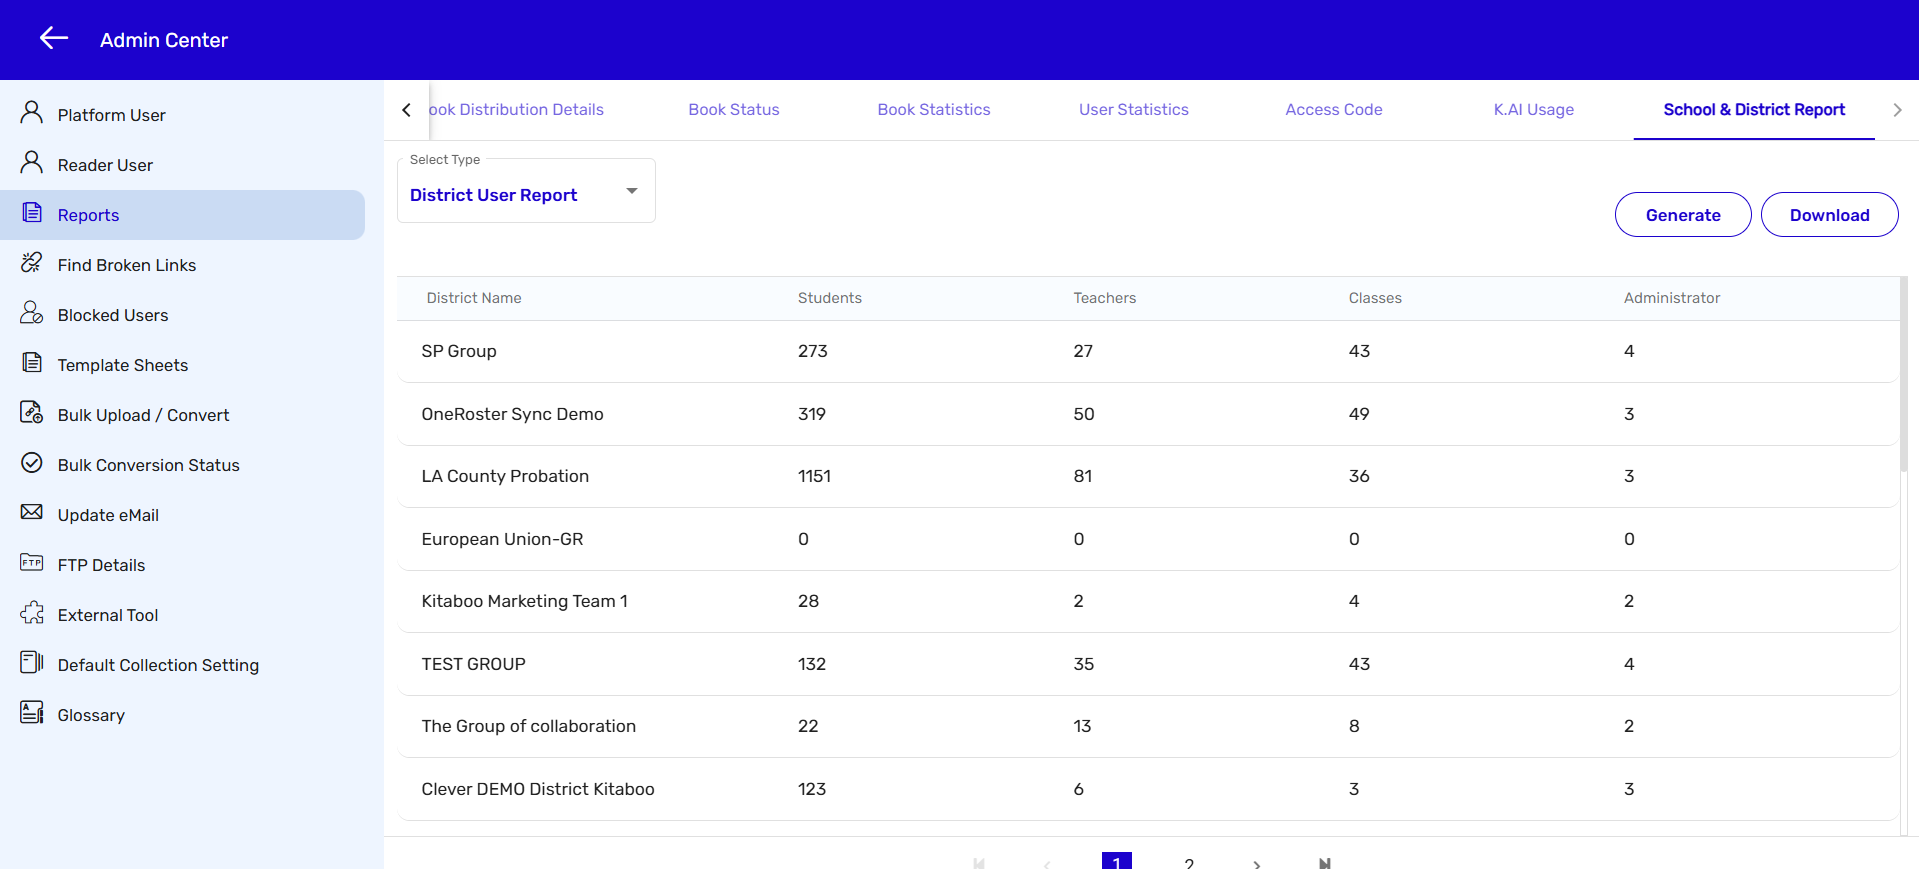
5. District User Report
Purpose:
This report provides a district-level summary of user distribution across all schools. It helps administrators track total student and teacher counts, number of classes, and administrative users at the district level.
Value:
-
Helps track total adoption across schools
-
Useful for yearly audits and compliance
-
Supports district-level instructional planning
-
Helps identify schools needing additional support
Key Data Fields:
- School District Name
- Number of Students
- Number of Teachers
- Number of Classes
- Number of Administrators
6. District Onboarding Report
Purpose:
This report gives a consolidated view of how schools within a district are onboarded into Kitaboo. Administrators can track onboarding type, rostering method, number of onboarded schools, sync status, and data refresh frequency. This is crucial for ensuring centralized onboarding compliance and data accuracy across the district.
Value:
-
Ensures smooth rostering for entire district
-
Helps IT teams find failing or outdated syncs
-
Supports onboarding compliance
-
Helps in managing multiple schools at scale
Key Data Fields:
- Created On
- Group ID
- District Name
- Onboarding Type (Google Classroom, LTI, OneRoster, etc.)
- Rostering Type
- Status
- Number of Schools
- Last Sync Status
- Sync Frequency (Manual or Auto)
- Period (Daily / Monthly / Yearly, etc.)
