Popular

- Manage License (Add on)
- Bulk Revoke
- Generating Access Code
- Direct Distribution (Add On)
- Creating Single User or Multiple Users (Bulk Upload)
- Admin Center and Profile and Settings
- Revoking Content
- Distributing Content
- Signing in to Kitaboo
- Promote User/Transfer
- Create Class/Update Class
- Selective Oneroster Sync with API/ZIP/SFTP

- Customer Order Details -View Order
- License Management
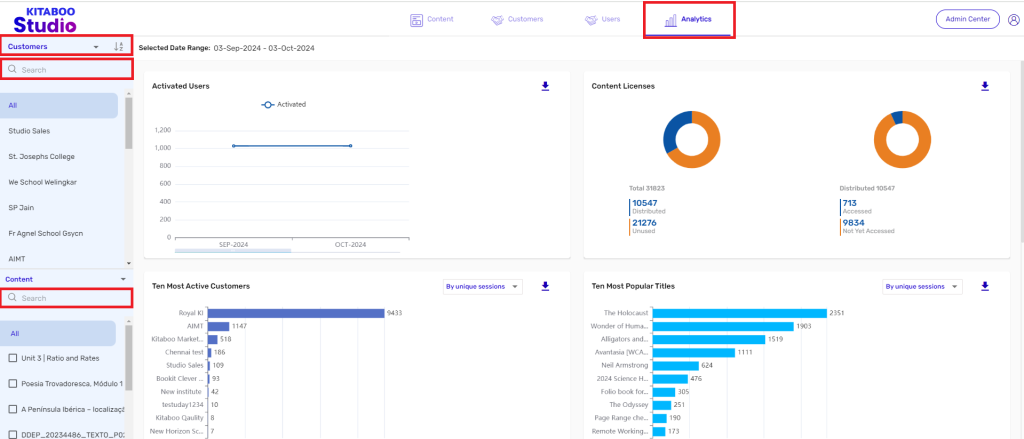
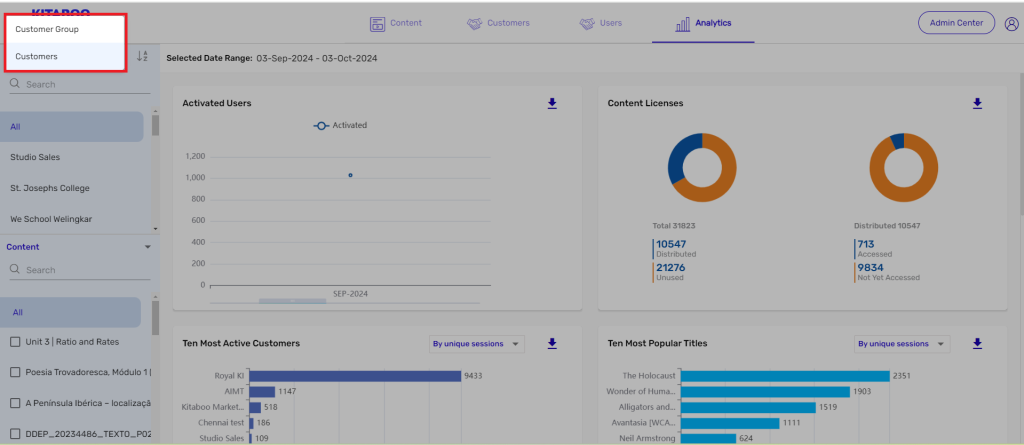
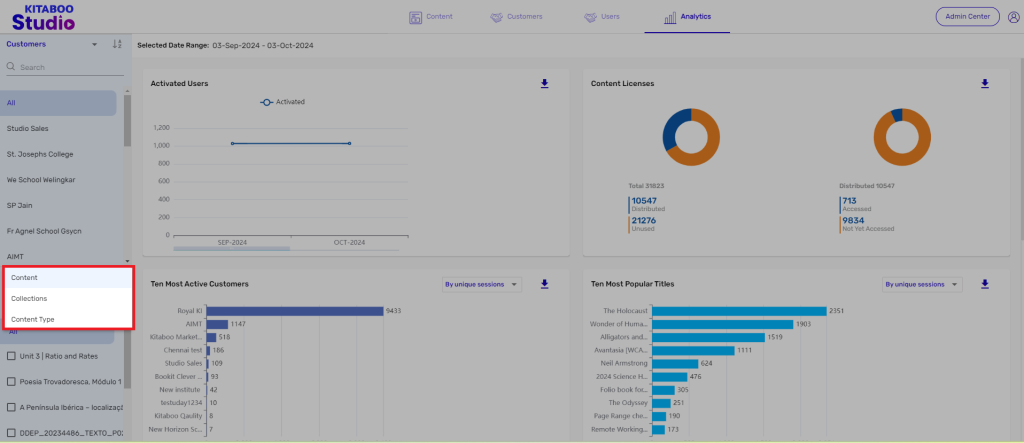
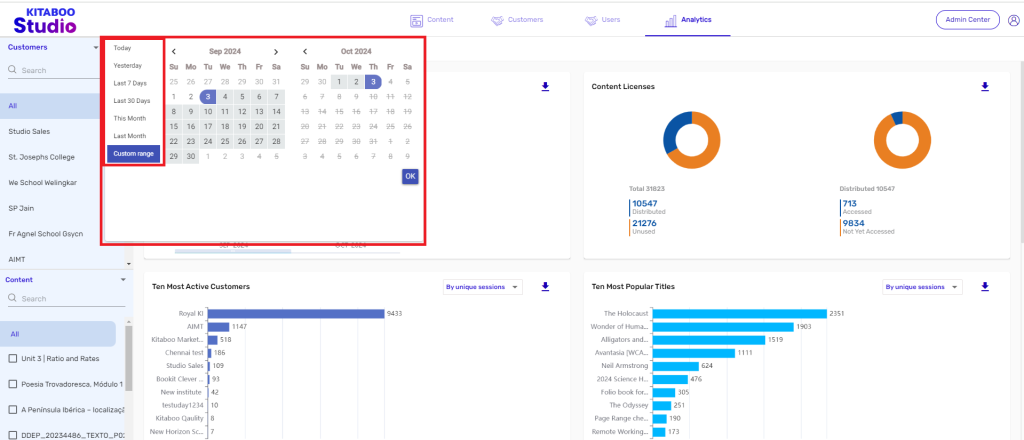
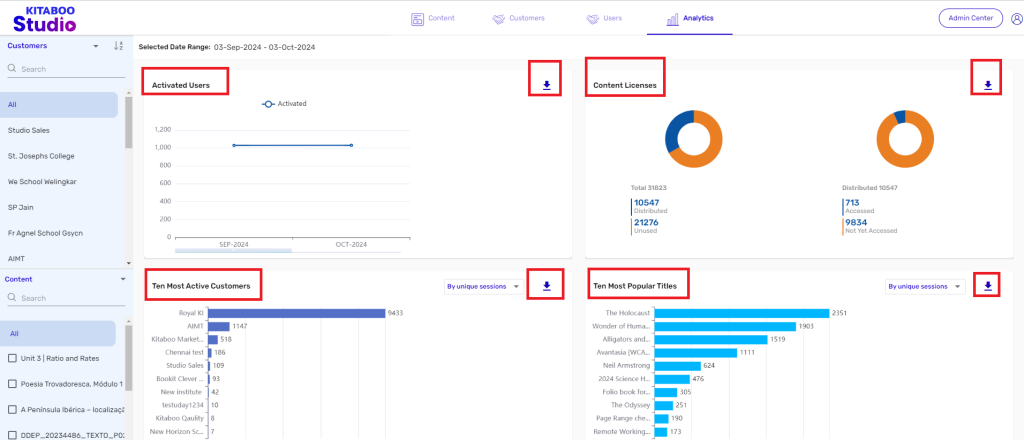
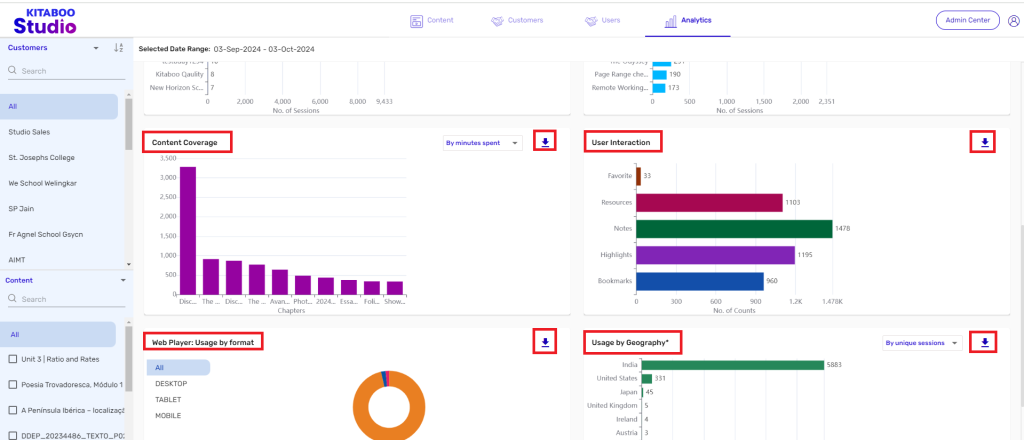
- Analytics Dashboard and Reports Overview
- How Kitaboo Reader – Text-to-Speech (TTS) Works
- Activated User – Definition & Billing Policy
- What is Sequential Learning and How to Enable It? (Add On)
- Understanding User Roles: Producer vs. Admin
- How to Add External LTI Link (Add-On)
- Auto Book Deletion Process
- Adding group with SAML
- Syncing Data with Clever
- Selective Oneroster Sync with API/ZIP/SFTP
- Syncing Data with PowerSchool
- Syncing Data with OneRoster
- Adding a Group
- Searching a Customer
- Issuing Licenses
- Editing a Customer
- Deactivating a Customer
- Adding a Google Classroom Customer
- Adding a OneRoster Customer
- Adding One roster 1.2
- Adding a LTI 1.3 Customer with OneRoster
- Adding a LTI 1.3 Customer
- Adding an LTI 1.1 Customer with OneRoster
- Adding LTI 1.1 Customers
- Sorting Customer and Group
- Creating a Collection
- Enable K-AI at the content level
- Content Lifecycle Stages in Kitaboo for eBooks
- Creating a Fixed-layout Kitaboo eBooks
- Creating Fixed-layout ePub 3.0
- Upload 3rd Party ePub 2.0/3.0
- Creating a Course or Uploading Scorm
- Activity or Gradable Activity Creation
- Authoring an ePub
- Creating a Video Book
- Creating an Audio Book
- Updating the Cover Image
- Editing a Fixed eBook
- Deleting and Deactivating Content
- Users Tab
- How to Edit and Delete a Category
- Clever Integration
- Classlink Integration
- Canvas LTI Integration
- Admin Center
- Analytics Tab
- Adding a Customer
- Creating Admin Accounts