Popular
- Manage License (Add on)
- Bulk Revoke
- Generating Access Code
- Direct Distribution (Add On)
- Creating Single User or Multiple Users (Bulk Upload)
- Admin Center and Profile and Settings
- Revoking Content
- Distributing Content
- Signing in to Kitaboo
- Promote User/Transfer
- Create Class/Update Class
- Selective Oneroster Sync with API/ZIP/SFTP
- Analytics Dashboard and Reports Overview
- How Kitaboo Reader – Text-to-Speech (TTS) Works
- Activated User – Definition & Billing Policy
- Understanding User Roles: Producer vs. Admin
- Auto Book Deletion Process
- Adding group with SAML
- Syncing Data with Clever
- Selective Oneroster Sync with API/ZIP/SFTP
- Syncing Data with PowerSchool
- Syncing Data with OneRoster
- Adding a Group
- Searching a Customer
- Issuing Licenses
- Editing a Customer
- Deactivating a Customer
- Adding a Google Classroom Customer
- Adding a OneRoster Customer
- Adding One roster 1.2
- Adding a LTI 1.3 Customer with OneRoster
- Adding a LTI 1.3 Customer
- Adding an LTI 1.1 Customer with OneRoster
- Adding LTI 1.1 Customers
- Sorting Customer and Group
- Enable K-AI at the content level
- Content Lifecycle Stages in Kitaboo for eBooks
- Creating a Fixed-layout Kitaboo eBooks
- Creating Fixed-layout ePub 3.0
- Upload 3rd Party ePub 2.0/3.0
- Creating a Course or Uploading Scorm
- Activity or Gradable Activity Creation
- Authoring an ePub
- Creating a Video Book
- Creating an Audio Book
- Updating the Cover Image
- Editing a Fixed eBook
- Deleting and Deactivating Content
- Users Tab
- How to Edit and Delete a Category
- Clever Integration
- Classlink Integration
- Canvas LTI Integration
- Admin Center
- Analytics Tab
- Adding a Customer
- Creating Admin Accounts
- Q1. How can I get help with a specific service?
- Q2. How do I report bugs or request service enhancements?
- Q3. As the main institute admin, if I revoke or delete a user created using an access code, can the same access code be reused? What will be the expiry period for that access code’s content?
- Q4. As a main institute admin, can I change the password(s) of institute(s) associated with my account?
- Q5. Why is my Customer ID and Password not working?
- Q6. As a main group admin, can I change the password(s) of groups (sub-admin) associated with my account?
- Q7. How can I redeem an access code?
- Q8. What is a common access code?
- Q9. While distributing content to all classes in one go, how does a user know if he/she has been assigned content?
- Q10. While distributing content, can I restrict access to it to teachers only?
- Q11. What are the prerequisites for adding a user to an existing class?
- Q12. Can I create a class with students only?
- Q13. How can I create multiple users on the Kitaboo system?
- Q14. Why is my Group ID and Password not working?
- Q15. I forgot my password. How do I reset it?
- Q16. How do I log in to the Kitaboo portal/Reader?
- Q17. How can I search for a Custom Order ID while assigning content or a collection in the Institute/Customer login?
- Q18. How to add a custom order ID to a new order or an Existing order?
- Q19. What is the API update process, how are changes communicated, and what is the support period for deprecated features?
- Q20. What is the notification process for product release notifications, product issues (discovered by Kitaboo), and product outage/downtime notifications?
- Q21. Why are some symbols not displaying correctly in my eBook or why is the file failing during the conversion process?
- Q22. Does Kitaboo support the Chinese language?
- Q23. What types of quiz activities does Kitaboo support?
- Q24. What is the file size limit supported in Kitaboo?
- Q25. What happens if I do not provide a Table of Contents (TOC) sheet during the bulk upload process in Kitaboo?
- Q26.How does the Multiple Admin Edit feature work, and what are its limitations?
- Q27.How to Update Widgets/Activities in Kitaboo After New Fixes or Enhancements Are Deployed ?
- Q28. Print Configuration in Kitaboo Reader.
- Q29. Glossary Instructions Guide (Kitaboo Fluid 360)
- Q30. WCAG 2.2 Compliance – Reader and Content Responsibilities
- Q31. Keyboard Shortcuts for Table and TOC Management in Author (Kitaboo Fluid 360)
- Help Screen: Your Personal Guide
- Easy Steps to Create or Upload a Cover Page
- Creating a structured Table of Contents (TOC)
- Choosing the Perfect Layout
- #1. Add content using the Authoring
- 1.1. Title: A Simple Way to Add Clear, Catchy Headings!
- 1.2. Explore the smart “Header” Element!
- 1.3. Discover the Power of Text in Authoring!
- 1.4. Make Your Pages Come to Life with Images!
- 1.5. Add Engaging Videos to Your Pages!
- 1.6. Add Engaging Sounds to Your Pages
- 1.7. Explore HTML Interactivity!
- 1.8. Organize your data with the Table element!
- 1.9. Callout Box: A Handy Way to Highlight Important Information!
- #2. Explore Fun and Interactive Widgets with the Authoring Platform
- 2.1. Multiple Choice activity
- 2.2. Create Engaging Presentations with the Slideshow Component!
- 2.3. Image Labelling: Make Your Pictures Interactive!
- 2.4. Fill in the Blanks: Fun and Interactive Learning!
- 2.5. Highlighter: Your Handy Tool for Highlighting Important Text!
- 2.6. Correction Element: Make Learning Fun and Interactive!
- 2.7. Sorting Component – Organize with Ease!
- 2.8. Match the Pairs: An Interactive Learning Tool!
- 2.9. Easy-to-Use Sidebar for Your Content
- 2.10. Click to Reveal activity – Making Learning Fun!
- 2.11. Explore the Fun World of Wordsearch
- 2.12. Discover the Flashcard Element for Your Learning Journey!
- 2.13. Explore the “Group Activity” Element
- 2.14. Discover the Fun of Categorizing with the “Categorize” widget
- 2.15. Explore the Question and Answer Activity
- #3. Unlock the Power of Gradable Activities in Kitaboo’s Authoring Platform
- 3.1. Creating a Gradable Activity
- 3.2. Adding a Gradable Activity in an eBook
- 3.3. Students Accessing the Activities
- 3.4. Standalone Gradable Activity
- 3.5. Grade Assessment: Activity Management for Admins and Teachers
- 3.6. Customizable Certificates for Course Completion
- #4. K.AI: Transforming Content Creation with AI-Driven Interactivity
- 4.1. K.AI Automatic Quiz Generation from PDF
- 4.2. Automatic Generation of Quiz from PDF Using K.AI Markup
- Kitaboo 6.0 Reader Accessibility Help Manual
- Login to Kitaboo Reader
- How to use Access Code
- Bookshelf Overview
- Bookshelf Search in Kitaboo Reader
- Guide to view Fixed Layout Ebooks
- Guide to view Reflowable ePUBs
- Guide to view VideoBooks
- Guide to view AudioBooks
- Changing Profile Settings in Reader
- Collections in Kitaboo Reader
- Viewing More Info in Kitaboo Reader
- How to add Bookmarks
- How to add Sticky Notes
- How to add Highlights
- How to use Pen Tool
- How to Access Resources
The Kitaboo system also allows you to Visualize and analyze your data in an effective way.
Let’s see how you can analyze your data effectively on the Kitaboo system.
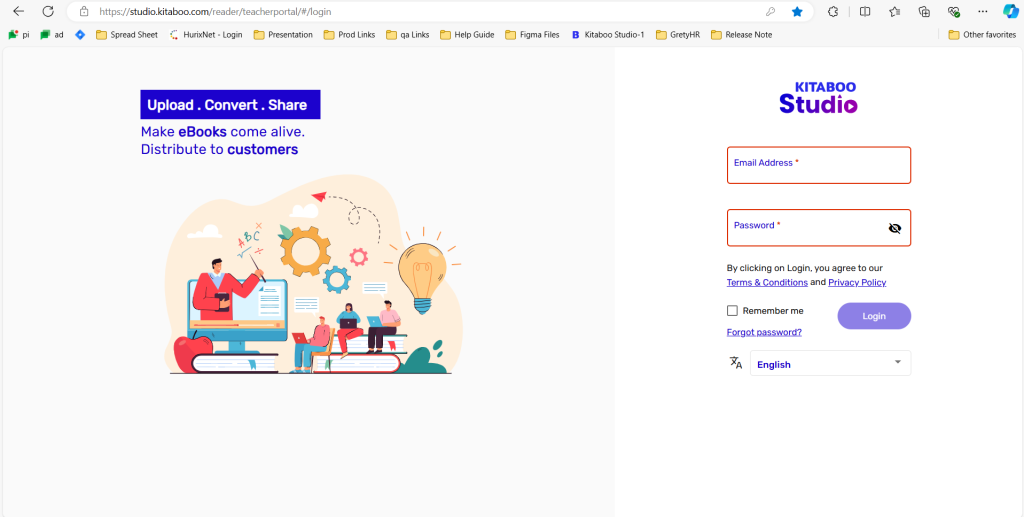
1. Sign in with your Enterprise Admin credentials.
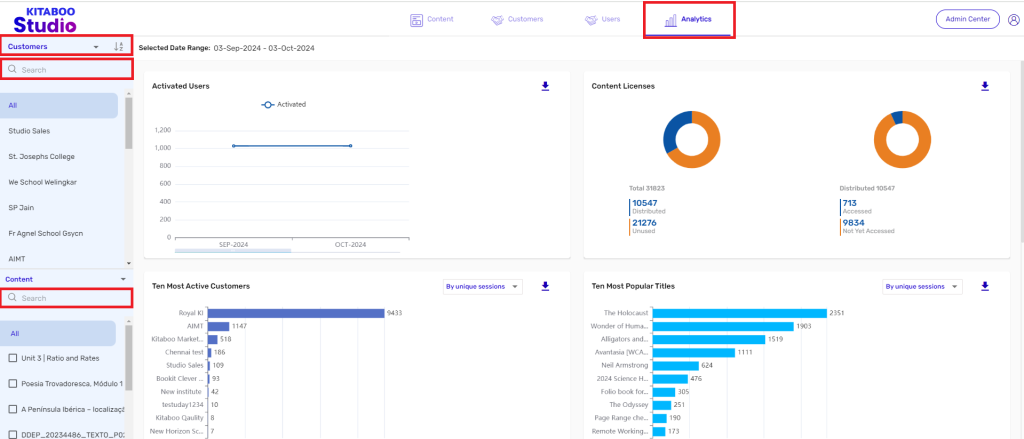
2. On the Dashboard, Click on Analytics Tab, to view analysis of your data. Click on
Customer Dropdown, to sort your customers or Click on Search Bar, to Search for your customer for whom you want to view data.
Note-: By default it’s showing data for all the Customers.
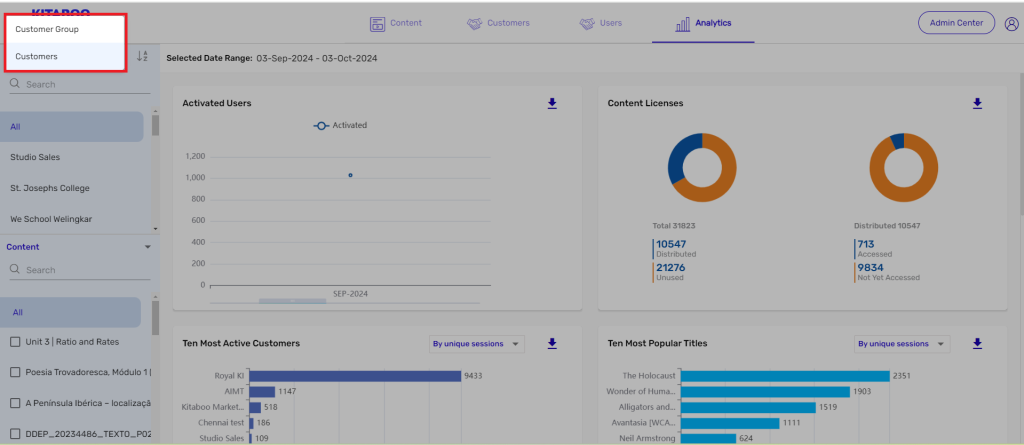
3. Click on Customers dropdown in the left side panel, you can sort your customers into Groups or Individual Customers.
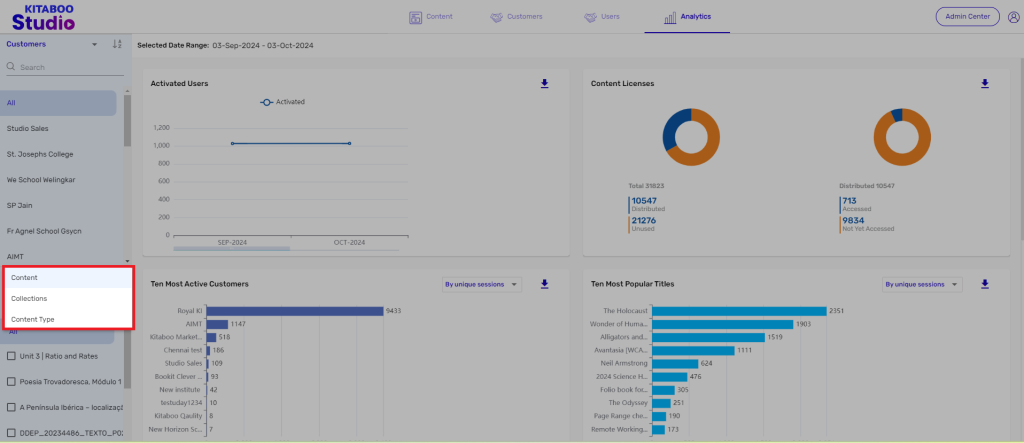
4. Click on Content Dropdown to sort your asset according to Content, Collection and Content type.
Note -: By default All is selected which shows data for all the content.
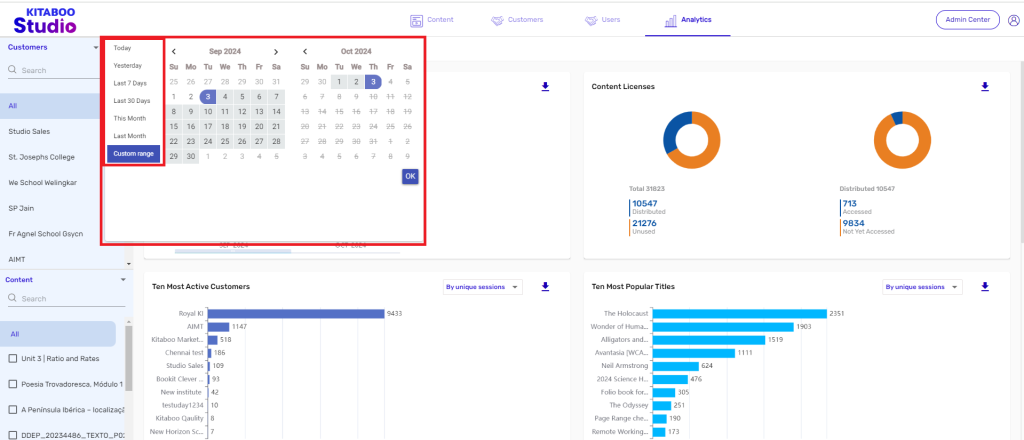
5. Click on Dates of Selected Date Range, to select the date and view data from Custom Range or select the pre-defined Time Period to view the data.
Note-: Only past 1 year data will be shown here.
6. You can Visualize your data according to Activated Customers, Content License,
Ten Most Active Customers, Ten Most Popular Titles. Click on Download Icon to download the Analytics Reports.
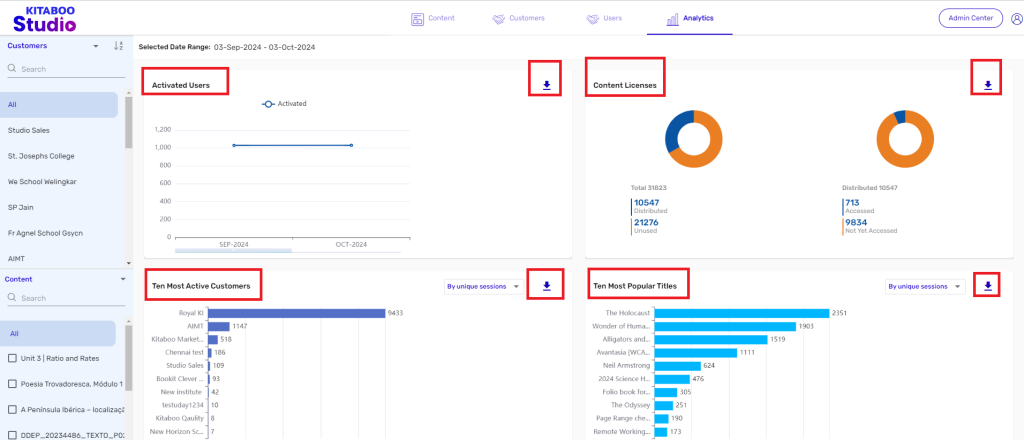
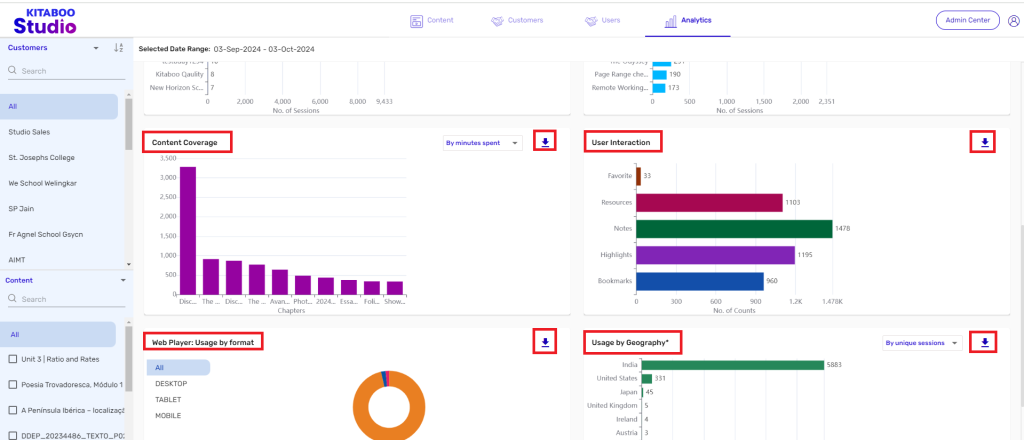
7. Furthermore, by Content Coverage, User Interaction, Web Player: Usage by Format and Usage by Geography also, you can visualize your data. Click on Download Icon to download the Analytics Reports.
Note-: Only data for Web Reader/Player is shown in Usage by format.
